
Amazon Strategy to Scale Business | AMAZON US Case Study : Toys Category
- Aditya S

- Feb 14, 2025
- 3 min read
Updated: May 7, 2025
A baby doll (Toys brand) wanted to penetrate effectively for its niche of Audience. The brand multiple sub-categories and a total of 250+ SKUs running at any given time. There plan was to scale efficiently and utilize $550K and generate a ROAS of > $8 for Amazon USA.
They were finding it challenging to scale the business profitably beyond a monthly spends of $6K as their ROAS was dropping below $4 which meant increasing revenue was not sustainable for the brand.
CLIENT BRIEF :
Project Duration Amazon Budget ROAS Goal
12 Months $550,000 > $8
RESULTS :
BIG WINS : Brand scaled from $0.5 million to $5Millions in 1 year.
AD Spends YOY AD Sales YOY ROAS YOY
800X 1000X 145%
What should be Amazon strategy to Scale Business ?
We followed the following amazon strategy to scale business for this brand
Understanding Market Share
Competitive Landscape
Identifying Opportunities
Customized Strategy for brand
Campaign Structures
Test, Retest and Implement
Any brand that Sellology onboards, we first take time out to understand the Market Share of the said category. This not only gives us an understanding of how big the market is but also tells what your brand can grow to be and how much revenue can be generated over a period of time.

Market Share trend data : Please note that trends do change the Market share data as new categories that are in trend continue to keep on growing.
Competitive Landscape : Since now we know the potential of the market that your products are into, the important question became how soon can we reach our revenue goals and competitive landscape data gives us good visibility on this.
From our The Leaders vs. Laggard graph we understand which brands are actively advertising within Toys ( sub category Dolls) category. Share of Voice ( SOV) graph tells us how aggressively these brands are bidding in these categories.
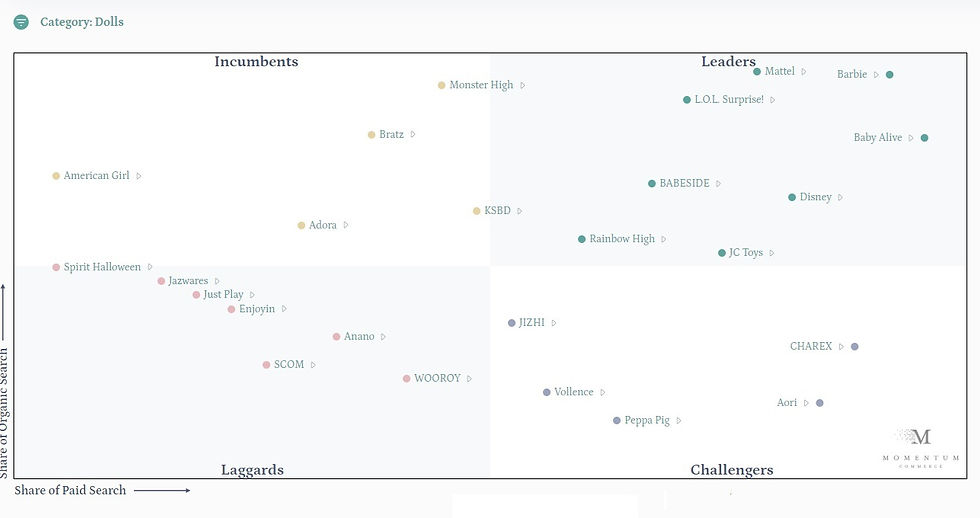
Leaders vs. Laggards Matrix Graph tells us where we would face competition from and which brands we need to bid against. 
SOV Analysis Identifying Opportunities : Targeting big revenue generating items and sweeping through their listings gives us a good database of keyword with opportunities. We identify keywords with good search volumes but low competition in them. This process can differ based on the budget and strategy for brands.

Customized Strategy for the brand : This is a customized plan that we create and present to the brand. This is confidential and customized for each brand separately.
Looking for a customized strategy for your brand ? Please reach out to us with your brand details and we will create a customized plan for you.
Campaign Structure are often overlooked by everyone but this is one of the most important piece that decides if all the items are going to get sufficient visibility on Amazon or this is focussed to a few items alone. Often agencies club together all items and create 3-5 campaigns ( with > 10 items per campaign). This means, your budget for these campaigns will get divided among these 10 items, where good performing items will get great impressions but poor performing ones will get low to zero impressions. We suggest not tagging more than 4-5 items each campaign.

Good Campaign structure for Auto ADs Test - Re Test and Implement : Needless to say results can't be generated within a week, but the key is to keep on finding opportunities every week and move the brand slightly ahead every week. The test, retest and implement strategy is one of the best that works both on Amazon and Walmart. We do guarantee measurable results with our strategy.
Results : Below is a graphical comparison of how we were able to scale the business.
2023 vs. 2024
AD Spends Increase : 8X
AD Sales Increase : 10X
ROAS %Change : 145% increase


Looking for a customized strategy for your brand ? Please reach out to us with your brand details and we will create a customized plan for you.

Comments